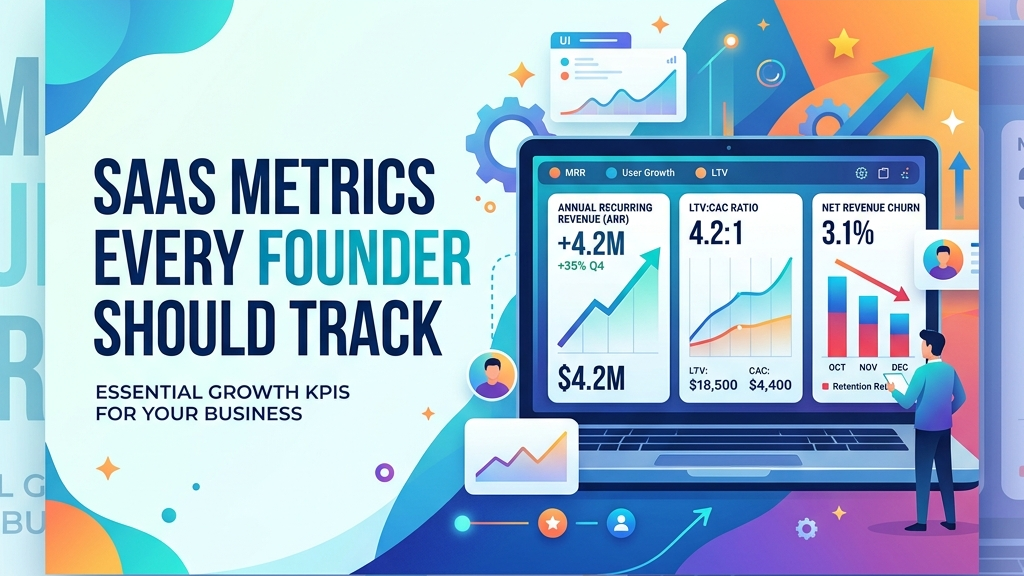
SaaS Metrics Every Founder Should Track
The metric card for Software-as-a-Service (SaaS) companies has fundamentally changed. During the low-interest-rate environment of the early 2020s, venture capitalists and founders prioritized a single metric: top-line growth. In 2026, the market has pivoted. Today, the focus is squarely on capital efficiency, sustainable growth, and net revenue retention.
Investors are no longer asking, "How fast can you grow?" instead, they ask, "How much cash do you burn to add a dollar of recurring revenue, and how well do you hold onto your existing customers?"
For founders, flying by gut feeling is a recipe for running out of runway. You must understand your startup's core unit economics. This guide outlines the essential SaaS metrics every founder must track in 2026, including benchmarks and calculations.
1. Customer Acquisition Cost (CAC) Payback Period
Your Customer Acquisition Cost (CAC) Payback Period is the number of months it takes for a customer to generate enough gross profit to cover the initial cost of acquiring them. It is the single best indicator of your sales and marketing efficiency.
The Formula
To calculate this metric accurately, you must factor in your gross margin:
$$\text{CAC Payback Period (Months)} = \frac{\text{Average CAC}}{\text{Monthly ARPU} \times \text{Gross Margin \%}}$$
- Average CAC: Total Sales & Marketing spend divided by the number of customers acquired in a given period.
- ARPU: Average Revenue Per User (or account) per month.
- Gross Margin: The percentage of revenue remaining after subtracting hosting, onboarding, and direct support costs (typically 75% to 85% for SaaS).
2026 Benchmarks
- Elite (< 90 Days): Excellent marketing channels, high product-led growth (PLG), or strong organic word-of-mouth.
- Healthy (6 – 9 Months): Standard for well-performing B2B SaaS platforms targeting small-to-medium businesses.
- Caution (> 12 Months): Your acquisition channels are too expensive. If a customer churns before month 12, you lose money on their acquisition.
2. Capital Efficiency: The Burn Multiple
Popularized by VC firm Craft Ventures, the Burn Multiple has become the primary metric investors use in 2026 to evaluate structural cash efficiency. It measures how much cash a startup burns to generate one dollar of Net New Annual Recurring Revenue (ARR).
The Formula
$$\text{Burn Multiple} = \frac{\text{Net Burn}}{\text{Net New ARR}}$$
- Net Burn: Total cash spent minus revenue received in a given period (usually quarterly).
- Net New ARR: The growth in ARR during the same period (New customer ARR + Expansion ARR - Churn/Contraction ARR).
2026 Benchmarks
- Amazing (< 1.0x): You generate more new recurring revenue than you burn in cash. This is highly attractive to investors.
- Good (1.0x – 1.4x): Healthy scaling. Your spend is productive and matches revenue growth.
- Sloppy (> 2.0x): You are burning $2.00 in cash to generate $1.00 of recurring revenue. This burn rate is unsustainable in the current capital market.
3. Retention: The NRR & GRR Duo
Growth is meaningless if your customer base is leaking out the bottom. In 2026, retention is the primary input for SaaS valuation multiples. High retention creates compounding growth that does not require additional sales spend.
Retention Metrics Defined:

1. Gross Revenue Retention (GRR)
   - Measures the stability of your starting revenue base.
   - Max capacity is 100% (excludes expansion/cross-sells).
   - Formula: (Starting ARR - Churn - Contraction) / Starting ARR

2. Net Revenue Retention (NRR)
   - Measures your ability to grow revenue from within your existing customer base.
   - Can exceed 100% (includes upsells, expansions, and seat additions).
   - Formula: (Starting ARR + Expansion - Churn - Contraction) / Starting ARR
2026 Benchmarks
- Best-in-Class (NRR 120%+ / GRR 92%+): Typical for enterprise B2B SaaS where expansion offsets minor customer churn.
- Healthy (NRR 105% – 110% / GRR 85% – 90%): Standard for mid-market B2B platforms.
- Concern (< 95% NRR): If your NRR is under 95%, you are losing more revenue than you expand, forcing your sales team to constantly acquire new customers just to stay flat.
4. Balancing Growth and Profit: The Rule of 40
The Rule of 40 is a classic SaaS metric that evaluates whether a company is growing at a healthy rate relative to its profit margins. It is the gold standard for late-stage and public SaaS, but is increasingly applied by pre-series A investors to evaluate product health.
The Formula
$$\text{Rule of 40 Score} = \text{ARR Growth Rate \%} + \text{Free Cash Flow (FCF) Margin \%}$$
- ARR Growth Rate: Year-over-year growth in recurring revenue.
- FCF Margin: Free Cash Flow divided by total revenue. If your company is unprofitable, this will be a negative percentage.
For example, if your SaaS is growing at 50% year-over-year but has a -15% cash flow margin, your score is 35% ($50 - 15$). If you are growing at 25% but have a 20% profit margin, your score is 45%.
2026 Benchmark
Crossing the 40% threshold makes your SaaS company highly fundable and command premium valuation multiples during investment rounds.
5. Gross Margin: The SaaS Quality Indicator
Gross Margin measures the direct profitability of delivering your software, separating "true SaaS" from tech-enabled services.
The Formula
$$\text{Gross Margin \%} = \frac{\text{Total Revenue} - \text{COGS}}{\text{Total Revenue}} \times 100$$
- COGS (Cost of Goods Sold): Direct costs of delivering the software. This includes cloud hosting bills (AWS/Vercel), third-party API fees (Stripe, Twilio, OpenAI), customer onboarding costs, and customer support salaries.
2026 Benchmark
A healthy SaaS should maintain a Gross Margin of 75% to 85%. If your margin is lower (e.g., 50%), it usually indicates that your software is highly reliant on manual service labor or heavy AI model API costs.
Conclusion
To build a highly fundable and sustainable SaaS business in 2026, founders must move past vanity metrics like "total signups" or "website visitors" and focus on CAC payback, NRR, and capital efficiency.
At Axewik Technologies, we do not just build code; we help founders build successful software businesses. We integrate robust product analytics (PostHog, Mixpanel) and financial tracking dashboards into your SaaS platform, giving you real-time visibility into your unit economics from day one.
Need help setting up automated metrics tracking or building a scalable data dashboard? Contact the Axewik Product Strategy Team today to schedule a consultation.